The 2020 election was both a miracle and a tragedy. In the midst of a pandemic posing unprecedented challenges, local and state administrators pulled off a safe, secure, and professional election. This article discusses metrics of success in the adaptations that took place—record-high turnout, widespread voter satisfaction, a doubling of mail voting without a concomitant increase in problems often associated with absentee ballots, and the recruitment of hundreds of thousands of new poll workers. However, a competing narrative of a “stolen election” led to a historically deep chasm between partisans in their trust of the election process and outcome.
The 2020 U.S. election was both a miracle and a tragedy. It was a miracle in that election administrators, facing unprecedented challenges from a pandemic, were able to pull off a safe, secure, and professional election in which a record number of Americans turned out to vote. It was also a tragedy, though, because, despite these heroic efforts, lies about vote fraud and the performance of the system have cemented a perception among tens of millions of Americans that the election was “rigged.” This manufactured distrust has deeply damaged our democracy; the path to repairing it is not at all clear.
The Capitol Insurrection of 6 January 2021 will forever constitute the image of the 2020 election and the distrust that accompanied it. Despite the heroism and success we detail below, more than a hundred members of Congress voted to question and overturn the results in one or more states.
The enduring images of the 2020 election should have been very different. During the primary elections early in the year, the picture looked bleak, as poll-worker and polling-place shortages caused long lines of frustrated voters to risk their lives, while thousands of absentee ballots were rejected in places that had little experience with large-scale voting by mail. In the general election, however, an army of new poll workers, wearing personal protective equipment (PPE) and often administering the voting behind Lucite barriers, staffed polling places. Absentee voting [End Page 159] also set records, as rates of canceled mail ballots were dramatically lower than before the pandemic.
How did the country pull off a successful election under pandemic circumstances? What changes to the election infrastructure were necessary to accomplish this task? How can we reconcile this measurable success with convictions, strongly held by a sizeable share of the electorate, that the election was rigged? These are the questions this article seeks to answer.
Given the unfounded, partisan criticism that the election was “rigged” and “disastrous,” it is difficult in hindsight to reimagine what a true electoral disaster would have looked like and how close the United States came to experiencing one. The primary-season meltdowns in several states painted an ominous picture of institutional collapse threatening the general election. In several respects, the election system benefited from the timing of the pandemic, coming as it did in the middle of the presidential-primary season but hitting hardest just as Joseph Biden wrapped up the Democratic Party’s nomination. The baptism by fire in the primaries provided necessary lessons in how to solve pandemic-related problems so that both mail and polling-place voting could work properly come November.
The primary season began with few covid-related concerns, as Iowa, New Hampshire, South Carolina, and Nevada held their primaries and caucuses in late February. Super Tuesday (March 3) also came at the beginning of the pandemic, with California the only state of the fourteen holding primaries that day which had thus far recorded a case. Ohio, with its primary scheduled for March 17, became the first state to sound the alarm when the state’s public-health director ordered all polling places closed. The state then switched to almost all-mail balloting and extended the time to vote in the primary through April 28.1 Most other states with March primaries then postponed their elections until May and June. By late March, governors throughout the country had issued stay-at-home orders. The presidential-nomination process escaped pandemic-related disaster by just a few weeks, as Biden’s nomination seemed by that point all but assured.
Wisconsin was one of the states that did not reschedule its primary, and it became the cautionary tale as to what to avoid when conducting elections during a pandemic.2 On the ballot in that primary was an election for the state Supreme Court; partisan concerns replaced the flexible attitude toward postponement seen in other states. As the April 7 primary date approached and more than 2,500 covid cases were confirmed in the state, Governor Tony Evers ordered the election postponed. However, Republican legislative leaders successfully sued, and the Wisconsin Supreme Court ordered the election to go ahead as scheduled. Only on April 6 did it become clear that the primary would be held the next day.
The last-minute wrangling among the governor, the legislature, and [End Page 160] the courts exacerbated the state’s lack of preparedness to run a primary during the pandemic. The state faced a shortage of seven-thousand poll workers. To replace them, the governor mobilized 2,400 members of the National Guard. The state closed only 15 percent of its planned polling places, but the largest cities cut back dramatically on the numbers of polling places they made available. Milwaukee, the state’s biggest city, went from 180 polling places to just five, while Kenosha County went from 22 to ten and Green Bay opened just a pair of polling places instead of the 31 it normally would have. Hardest hit were voters of color; their turnout rate lagged whites by more than twenty percentage points.
Absentee voting rescued the Wisconsin primary from complete disaster.3 Nearly 60 percent of the 1.5 million voters who turned out cast their ballots absentee, compared to 3.6 percent in the 2016 primary. Total turnout declined from 2.1 million in 2016, when competitive primaries for both parties brought out both Democrats and Republicans. (Most of the dropoff in 2020 was concentrated among Republicans.) Rejection rates of absentee ballots decreased from 2016, as 13,614 ballots were rejected because of “insufficient certification” and another 7,085 were rejected because they were late or did not have a postmark. Rejection rates for African Americans were about twice that of whites, however, and rejections of first-time voters’ ballots were about a third higher than had been typical in previous elections.
The states with primaries scheduled for after April 7 heard the warning shot from Wisconsin loud and clear. Most shifted significantly toward mail balloting for the remainder of the primary season. As a result, absentee voting exploded in the primaries, but only in states that voted after March. Among states that voted in February and March, mail-ballot usage was virtually unchanged.4
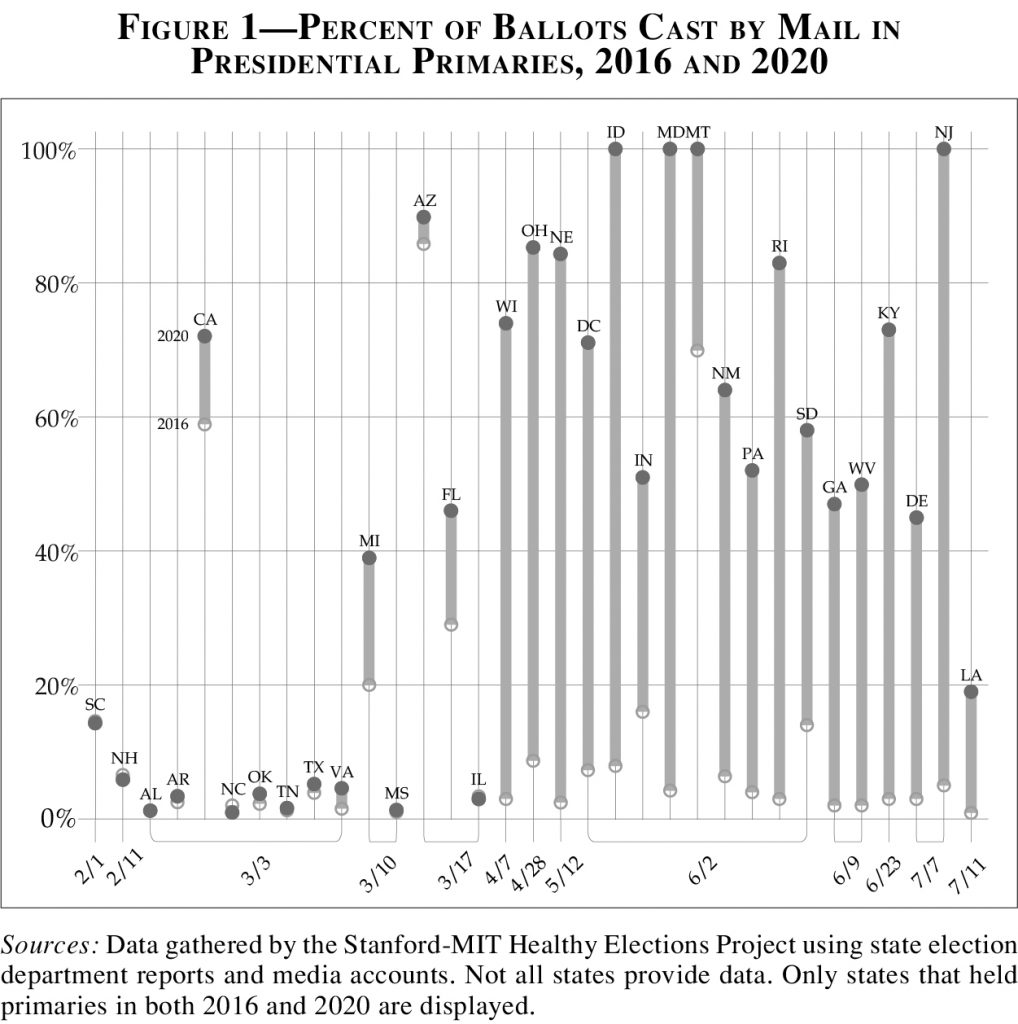
Beginning with Wisconsin’s April 7 primary and ending with Louisiana (July 11), every state saw a dramatic increase in mail-ballot usage—on average, 60 percentage points greater than 2016. Figure 1 depicts the shift in the mode of voting in the primaries that took place once the pandemic hit.
With increasing rates of mail balloting in the primaries came increases in ballot rejections. A nationwide study conducted by NPR estimated more than 550,000 mail ballots were rejected during the primaries, as compared to 318,728 in the 2016 general election.5 Given the dramatic rise in mail balloting, though, the share of rejected ballots even for the primary went down in many states. Georgia’s decline in mail-ballot rejections [End Page 161]
was particularly notable, dropping from 17 percent in the 2016 primary to less than 1 percent in the 2020 primary.6 Not every state experienced a drop, however. North Carolina—a state with relatively few mail ballots—saw its rate of mail-ballot rejections climb from 7 percent in the 2016 primary to 10 percent in the 2020 primary, mostly because of a dramatic increase in ballots that lacked a signature.7
Just as Wisconsin provided the cautionary tale for polling-place voting, New York City’s June 23 primary demonstrated the problems that plagued mail balloting. A whopping 84,000 ballots, representing 21 percent of all those coming from the city, went uncounted.8 Some ballots arrived late, while others were missing postmarks or the voter’s signature on the oath envelope. Ballot-design problems and poor coordination between local officials and the U.S. Postal Service seemed to underlie many of the rejections.
The primary period showed election administrators, policy makers, and the public that only an unprecedented effort could save the November election. New York highlighted problems with absentee voting, and illustrated what might happen if states with more traditional laws and practices did not change their ways, at least on an emergency, one-time [End Page 162] basis. Wisconsin provided an object lesson regarding the fragility of the in-person voting infrastructure, and a reminder that millions of people still preferred to vote in person even when doing so was dangerous. The nation’s election community had its work cut out for it in preparing for the fall.
Mobilizing to Cope with Covid
The shift to mail voting and healthy polling places in the general election did not just “happen.” States had to change their laws. Governors, health officials, and judges needed to impose emergency measures to deal with the pandemic.
Twenty-nine states and the District of Columbia enacted 79 different bills to expand voting access in 2020.9 Some states, such as California, New Jersey, Vermont, and Nevada, mailed every voter a ballot for the first time. Twelve states mailed absentee-ballot applications to all voters, and eight expanded eligibility for mail voting (whether by designating covid concerns as a valid excuse or by removing excuse requirements altogether). Four states enacted new “notice-and-cure” processes so that voters could remedy mistakes related to mail balloting; four provided prepaid postage for all mail ballots; four extended ballot-receipt deadlines; and five moved to permit the preprocessing of mail ballots so that ballots would be ready for counting once polls closed.
With respect to polling places, states relaxed rules on who could become a poll worker, raised the pay of poll workers, and required that jurisdictions not reduce polling-place numbers below a certain minimum. Some of these changes were permanent, while others were designated emergency steps taken only to deal with the pandemic. Many states that did not willingly make these changes were forced to do so by courts as a result of litigation.10
Along with policy makers and courts, civil society groups made an unprecedented effort to help local election administrators deal with the pandemic. The Stanford-MIT Healthy Elections Project, which we led, was a small part of that effort. Other organizations, such as the Center for Tech and Civic Life (CTCL), the Center for Secure and Modern Elections, the Center for Inclusive Democracy, the National Vote at Home Institute, Democracy Works, the Center for Civic Design, the Center for Election Innovation and Research, and a multitude of state-based organizations worked with election officials to provide resources and technical assistance in support of mail voting and safe polling places.
A key achievement of this civil society mobilization was the recruitment of poll workers. Following the primaries, poll-worker shortages appeared to present a critical threat to the November election. In previous elections, roughly half the poll workers nationwide had been more [End Page 163] than 61 years old, putting them into a higher-risk group amid a pandemic.
A host of organizations representing students (Campus Compact and Students Learn Students Vote), lawyers (the Association of ProBono Counsel and the American Bar Association), physicians, and other groups mobilized to fill the need. None was more influential than PowerthePolls. org. Working with the database of election offices provided by WorkElections.com and a multitude of partners at the state level, Power the Polls initiated a national poll-worker recruitment program that signed up more than 600,000 volunteers. (To give some context, roughly a million people served as poll workers in the 2016 election.) Exactly how many of those who signed up ended up serving is not known, but poll-worker shortages did not appear to afflict any major jurisdiction in the November election.
Perhaps the most unprecedented outside effort to bolster the election infrastructure came in the form of philanthropic contributions to election offices. Through the CARES Act, Congress had appropriated $400 million for assistance to election jurisdictions.11 In the end, private philanthropy contributed even more. Mark Zuckerberg and Priscilla Chan alone contributed $400 million.12 This money was administered through a CTCL grant program to more than 2,500 election jurisdictions. It paid for staffing, mail-voting equipment, drop boxes for ballots, PPE for poll workers, election security, polling-place rentals and sanitation, staffing and real-estate costs, poll-worker training, and a host of other things. By all accounts, these added funds were critical to the successful administration of the election. The same could be said for corporate in-kind donations, which included the arenas that National Basketball Association franchises lent for use as early-voting centers as well as other kinds of donations that were made through groups such as Business for America.13
One final set of outside actors deserves mention: internet platforms. Google and Facebook were widely reviled in 2016 for being sources of foreign election interference through both advertising and organic content. While they continued in 2020 to serve as platforms on which domestic disinformation and propaganda prospered, they developed products to provide and amplify authoritative information from election officials. The Google Civic Information API, developed from the Voting Information Center run by Democracy Works in consultation with local election offices, powered numerous web portals that provided information on polling places, voter-registration procedures, ballot-dropbox locations, and much else.14 Facebook’s Voting Information Center provided similar data, as well as information from third parties such as the Bipartisan Policy Center that could be deployed in users’ feeds to mute the impact of other, potentially less authoritative, stories on the voting process.15 In addition, Facebook reports that the portal, which also produced top-of-feed reminders, assisted more than 4.5 million people in registering [End Page 164] to vote and more than a hundred-thousand people in signing up to serve as poll workers.16
Success Against All Odds
The most basic measure of the success of an election is turnout. By this metric, the 2020 election was an unalloyed success by U.S. standards. Nearly 160 million votes were cast in 2020, up by more than 20 million from 2016. This amounted to two-thirds of the eligible electorate, six points higher than 2016 and the highest turnout rate since 1904.17
Turnout as a percentage of the voting-eligible population increased in every state, although there was considerable variation. The most significant increases came in the West and along much of the Eastern Seaboard. The smallest increases—they were in the low single digits—occurred in the country’s midsection, where states went to the least trouble to increase access to the polls and where the presidential race was mostly uncompetitive.
What explains the turnout surges and where they occurred? Our own statistical analysis finds that heightened electoral competition in the battleground states and the availability of election-day registration (EDR) were important. The most competitive states (measured by the margin of victory) and states that instituted EDR after 2016 saw the biggest turnout increases that pass the standard criteria of statistical significance.18 Mailing a ballot to all voters and adopting no-excuse absentee voting did not have statistically significant effects.
Turnout was not the whole story, of course. The main story, indeed, was the shift to mail balloting. Even if efforts to encourage more voting by mail played a modest role in boosting turnout, the shift to vote-by-mail was as much as anything an effort to protect public health in a high-intensity election. Mail balloting had already been increasing in importance over the past two decades, as 21 percent of voters cast votes by mail in 2016, up from 8 percent in 1996. But that figure doubled in 2020 as 46 percent of voters cast their ballots by mail. Election-day voting dropped by half, consequently, from 60 percent of voters in 2016 to 28 percent in 2020.19
The national trend toward mail voting masks considerable variability in the degree of change across states and, in some cases, the exact mix of election-day, early in-person, and mail voting. This is illustrated in Figure 2, which uses a ternary plot to show the changing mix of voting modes from 2016 to 2020. This plot employs points to show the mix of voting modes used in each state, as reported by voters in the 2020 Survey of the Performance of American Elections (SPAE).20 Attached to each point is a line that indicates the distribution of modes in 2016. Election-day voting dominated in the states toward the top of the plot; states toward the lower right mostly voted in person before election day; [End Page 165]
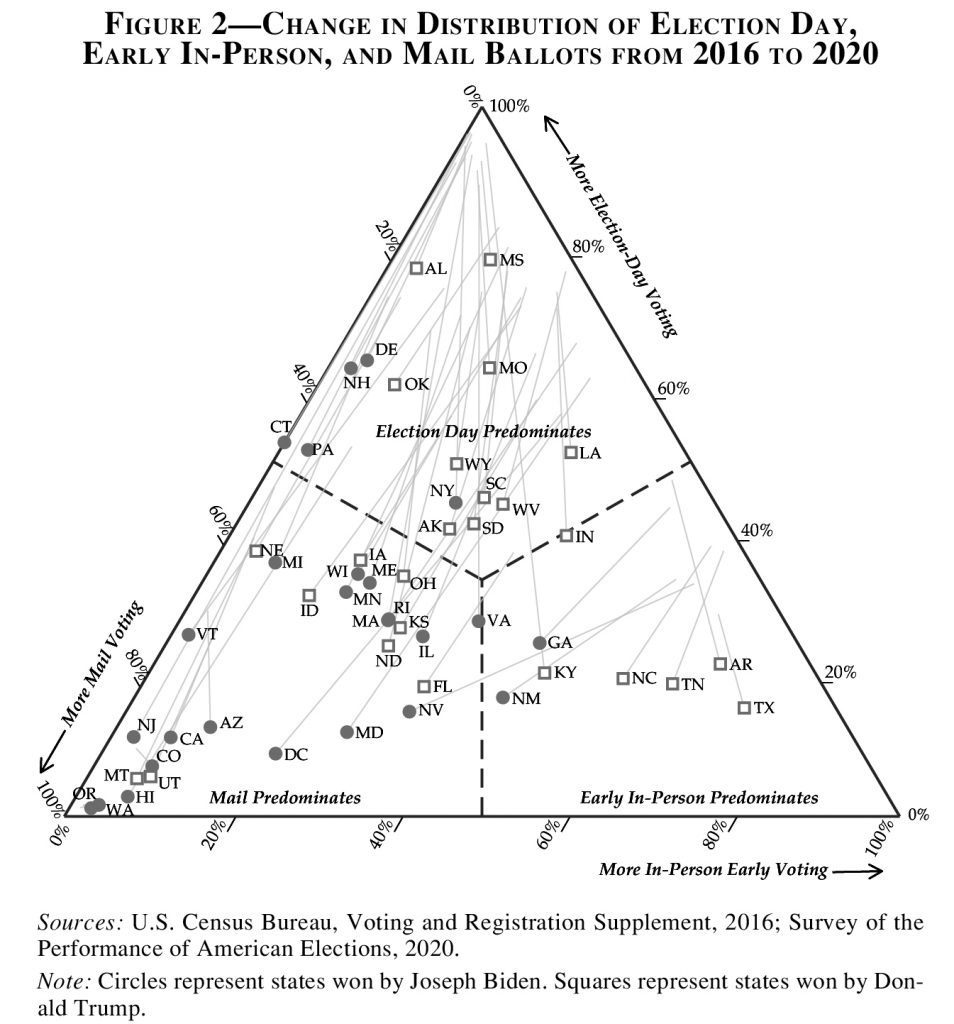
and mail balloting dominated in states toward the lower left.
The most common type of change was toward the southwest in the graph—that is, substituting election-day voting for mail ballots. In only eight states (Arizona, Arkansas, Indiana, Kentucky, Louisiana, Mississippi, Missouri, and Texas) did the increased share of in-person voters before election day exceed the increased share of mail voters.
Postelection responses to the SPAE describe the reasons behind the shift to mail balloting. Overall, 59 percent of respondents who stated that they were very worried about family members catching covid reported having voted by mail, compared to 28 percent who said they had no covid worries. This difference was visible within each party. Among Republicans, 42 percent who were very worried about covid voted by mail, while only 26 percent who had no covid worries at all said they had cast their ballots this way. Among Democrats, those figures were 62 and 35 percent. [End Page 166]
A state’s legal regime dramatically affected its rate of absentee balloting. Voters in states with no-excuse absentee voting used mail ballots at a much higher rate (55 percent) than voters in other states (35 percent); voters in states that mailed ballots to all registered voters likewise voted by mail at double the rate of other states (81 percent versus 40 percent). The only policy that did not appear to affect usage rates was mailing an absentee-ballot application to all voters.21 Our analysis of relevant statistics indicates that the biggest increases in mail-ballot usage from 2016 to 2020 came in states that mailed ballots to all registered voters and that also had largely Democratic electorates.22
During the run-up to the November election, officials and commentators in the field expressed concern about whether voters who were new to mail voting would complete the vote-by-mail process successfully. In prior elections, voter mistakes and administrative problems had resulted in hundreds of thousands of mail ballots being turned down.23 With the volume of mail ballots seemingly set to double or triple, there was heightened concern that voters using mail voting for the first time might be disenfranchised, and that controversies over mail-balloting problems would generate broader doubts about the election’s legitimacy. Efforts by election officials, civil society, and the courts addressed these concerns. In the end, voters followed directions and returned their ballots quickly.
Fears also arose over late-arriving ballots. All states have deadlines for the receipt of mail ballots. Most require ballots to be “in hand” by the time the polls close on election day. A few allow a ballot to arrive within a given period after election day so long as there is proof (usually in the form of a postmark) that it had been mailed by the date of the election. With millions of voters poised to cast their first-ever mail-in ballots, and in view of the Postal Service’s well-known struggles, many worried that large numbers of voters would have their ballots tossed simply because the mail was too slow in delivering them. In 2016, late arrival was the most common reason save one for the rejection of postal ballots.24 Would the same happen in 2020?
It appears that it did not. Although comprehensive statistics have yet to be published, examination of absentee-ballot files from a few states reveals that a surprisingly small number of mail ballots arrived after November 3. Georgia, for instance, saw the number of ballots that arrived after that date (and which were therefore rejected) fall from 0.8 percent of ballots returned in 2016 to 0.2 percent in 2020. Consequently, although the number of mail ballots cast grew sixfold in the state, the number of ballots rejected for arriving too late grew only slightly (from 1,836 to 2,368). The numbers were similar in Wisconsin, despite the number of ballots cast by mail growing fifteenfold, from 91,000 to nearly 1.4 million. [End Page 167]
In North Carolina, as part of a legal settlement, the deadline for the receipt of absentee ballots after election day was lengthened from the normal three-day period to nine days because of the pandemic.25 In the course of the election, the number of mail ballots rose fivefold, from 198,035 in 2016 to 1,026,364 in 2020. Yet the number of ballots that arrived during the new nine-day grace period increased by only about five thousand (to 16,313). Indeed, the number of ballots that were rejected for arriving too late actually declined from 1,038 in 2016 to 797 in 2020. North Carolina was not unique: Data from the SPAE indicate that a greater percentage of mail voters reported returning their ballots more than a week before Election Day (73 percent) than had done so in the past two presidential elections (61 percent in each). Voters heeded the warnings and returned their ballots with enough time to spare.
Finally, preliminary evidence suggests that mail ballots were rejected at much lower rates in 2020 than in 2016. Final statistics from the 2020 election were not available at the time of this writing in March 2021. However, the website FiveThirtyEight has been able to gather data from 22 states plus the District of Columbia, and reports that rejection rates are down from the 2016 level in all but three of these jurisdictions.26 The website Ballotpedia, relying on different data sources in some cases, reports rejection rates as dropping in fourteen of twenty states.27
Direct analysis of the absentee-ballot files from the states that make them readily available tells a similar story. For instance, Wisconsin reported that only 0.2 percent of absentee ballots were rejected for any reason, compared to 1.8 percent in the April presidential primary and 2.3 percent in the 2016 presidential election.28 The percentage rejected for “certification insufficient,” which includes a missing voter or witness signature or a missing witness address, was a miniscule 0.07 percent (1,434 ballots out of nearly two-million returned). In Georgia, the number of mail ballots that were cast grew sixfold in 2020, to 1.3 million.29 But the overall number of rejected mail ballots declined from about 6,056 in 2016 (2.9 percent of all mail ballots returned) to 4,003 (0.3 percent). Of the state’s 2020 rejected mail ballots, 1,563 were for either missing or invalid signatures.
The Maintenance of In-Person Voting
Although the shift to voting by mail was the element of election administration that drew the most public attention, election officials were equally attentive to the challenges of maintaining polling places for both early voting and election day. Even with the big shift to mail balloting, maintaining polling places remained critical to the safe and effective conduct of the election. Some voters needed services that could only be provided in person, others distrusted the Postal Service, and still others heeded President Donald Trump’s calls to vote in person. [End Page 168] Many voters, including Democrats, still strongly desire to vote in person.30
According to one report, the 2016 election had involved about a hundred-thousand polling places, nearly 21,000 of which were eliminated in 2020.31 Half the eliminated polling places were in California alone, which mailed ballots to all registered voters. Most of the other states with the biggest drops in the number of polling places either mailed ballots to all registered voters (Nevada, New Jersey, and Vermont) or worked hard to divert voters to early voting at centers set up for that purpose (Kentucky and Maryland).
The type of facility in which people voted also changed in 2020. Between 2008 and 2016, the three most common sites for polling places had been schools (25 percent of in-person voters), churches (17 percent), and community centers (16 percent). In 2020, the top three were “other” government buildings (courthouses, municipal buildings, or city halls, but not schools, community centers, firehouses, or police stations) at 23 percent, community centers at 21 percent, and schools at 18 percent. In other words, in-person voting shifted to larger facilities over which local governments had greater control.
Although we cannot yet document precisely how well local officials maintained access to in-person voting, we can assess the experience of voters who cast ballots in person and judge indirectly how well the system performed. Here, as with mail voting, the conclusions are mostly positive, although things were far from perfect.
First, despite the net reduction of 21,000 polling places and the relocation of thousands more, in-person voters did not report greater difficulty finding their polling place in 2020. Second, among the other measures that the SPAE has followed over the years to assess the experience of in-person voters, 2020 was no different from past years. Third, in-person voters largely encountered polling places where they felt that safety measures were appropriately in place.32
That said, other public-health measures were less often observed. Barely half of in-person respondents (56 percent) reported that they found voting booths spaced out to respect social distancing, while fewer than half reported finding protective barriers between themselves and poll workers or seeing voting booths cleaned between uses (47 and 42 percent of respondents, respectively).
The one measure on which voters reported having a worse experience than in 2016 was the time spent waiting to vote in person. This was not surprising given the demands of social distancing and the closure of many polling places during the pandemic. The benchmark that we use is the percentage of in-person voters who had to wait more than thirty minutes to vote (the standard suggested by the Presidential Commission on Election Administration in its 2014 report).33
Wait times increased in 2020 up to levels not seen since 2008, the [End Page 169]
election year with the longest wait times on record. Roughly one in five early voters waited more than a half-hour to vote, as did one in seven election-day voters. The racial gap in wait times had closed for election-day voting in 2016, but not for early voting. The same remained true in 2020, just at longer wait times. On election day 2016, the share of both white and African American voters who had needed to wait more than thirty minutes had been 8.5 percent. In 2020, those proportions rose to 14.3 and 15.6 percent, respectively. In 2020 early voting, the disparity was greater: More than a quarter (26.6 percent) of African American early voters needed to wait a half-hour or more to vote, while this was true for just over a fifth (20.5 percent) of white early voters. This gap of six percentage points was similar to the nine-point gap (18 percent versus 9.2 percent) that had been observed in 2016.
Perception versus Reality
The story told here of a historic and heroic administration of the 2020 election is based on the observed facts and data. A competing narrative of dysfunction and a “stolen election” emerged in the election’s [End Page 170]
aftermath, propagated by President Trump and his supporters. Seeds of that narrative actually preceded the election, as Trump and his surrogates had primed the U.S. public, and more particularly his supporters, to expect fraud of historic proportions, which would be the cause of his defeat, if he lost. That lie then became weaponized on January 6, as the “Stop the Steal” movement descended on the Capitol for a deadly attempt at insurrection.
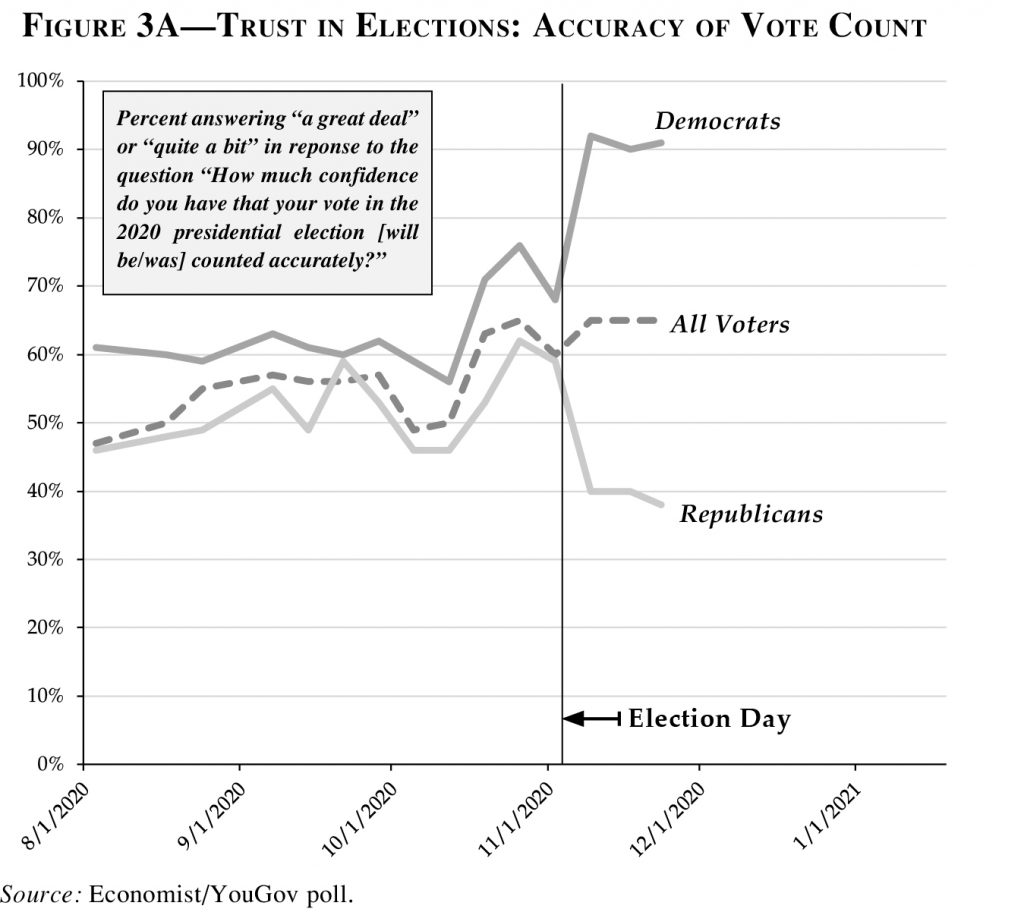
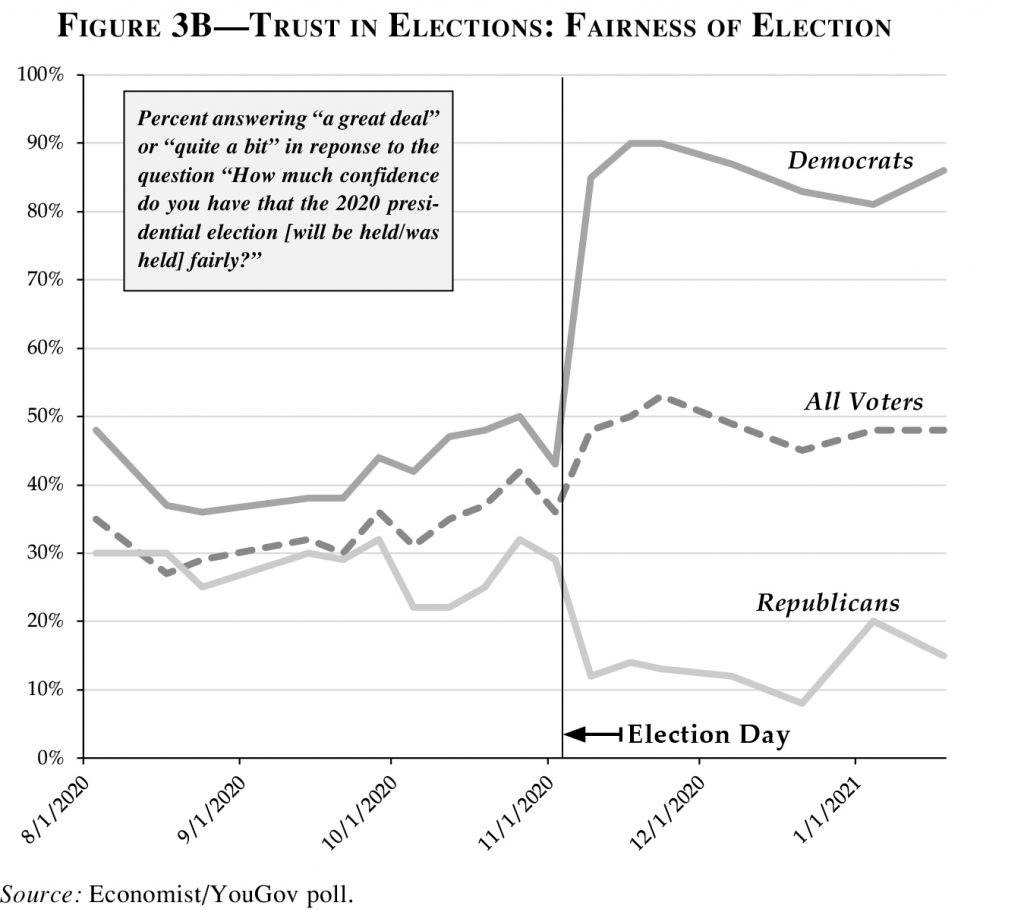
Partisan polarization concerning the fairness of a presidential election is not new, and to a large degree the basic patterns in 2020 mimicked what political scientists have found over the past two decades. In the case of 2020, roughly half of respondents to the Economist/YouGov series of polls between August and election day expressed “a great deal” or “quite a bit” of confidence that their own votes would be counted accurately in the upcoming election, while between 30 and 40 percent expressed confidence that the election would be “held fairly” (with Democrats slightly more confident on both measures than Republicans).
After November 3, the overall measures of confidence remained roughly unchanged, but the degree of partisan polarization exploded. (See Figure 3.) Before the election, Democrats were 10.9 points more confident their votes would be counted accurately than Republicans; after [End Page 171]
Election Day, this gap was 51.7 points. The gap in confidence that the presidential election was fair increased even more sharply, going from 15 points prior to November 3 to 72.6 points afterward.
As documented in earlier studies of voter confidence, the partisan split over assessing the election’s fairness can be attributed, to some extent, to the “winners-and-losers effect,” with the losing candidate’s supporters more likely to question the integrity of the process.34 In comparison to recent elections, however, the 2020 gap is extreme. A study of changes in voter confidence from before to after election day in the 2004, 2008, and 2012 presidential elections found that on average the gap between the parties increased 22 points on the question about confidence in one’s own vote being fairly counted, and 32 points on the question about confidence in the overall fairness of the election.35 We find that the net changes in 2016 were similar—17 and 18 points, respectively. In 2020, by contrast, the net gaps in confidence and trust increased 41 points for one’s own vote and 58 points on the election’s fairness overall.
Although this yawning partisan gap in perceptions of the accuracy and fairness of the 2020 election may be historic, the degree of partisan mistrust that has opened up at the state and local levels is also new. [End Page 172]
That mistrust will likely have more important near-term consequences, because of the preeminent role that states play in determining election policy. In the past, even when the two parties disagreed about the fairness of the national result, they were willing to acknowledge that local elections were conducted well, with only a small dose of loser’s effect thrown in. And, as recently as 2016, the two parties were virtually identical in how they judged state and local election administration.
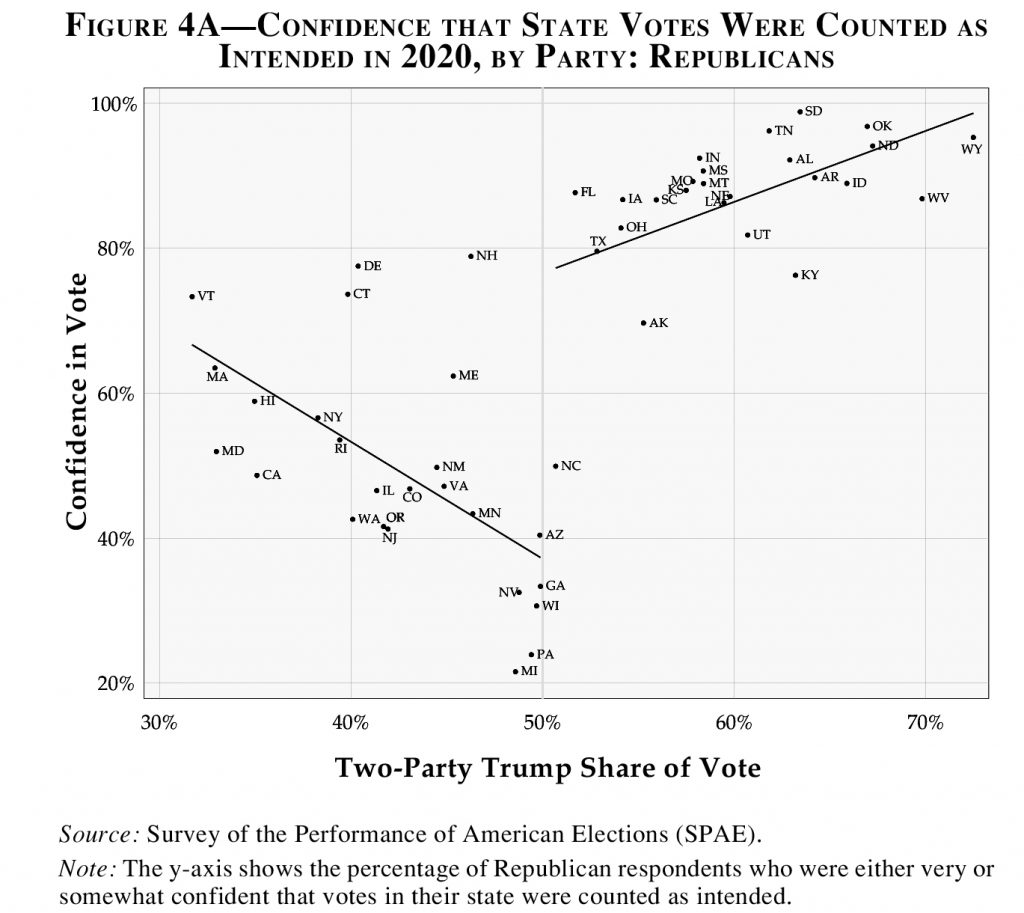
Not so in 2020. The Republicans most distrustful of the accuracy of state election results live in states that Trump barely lost. In fact, the chasm in trust between Republicans in states where he barely lost and those in states where he barely won is vast—40 percentage points.
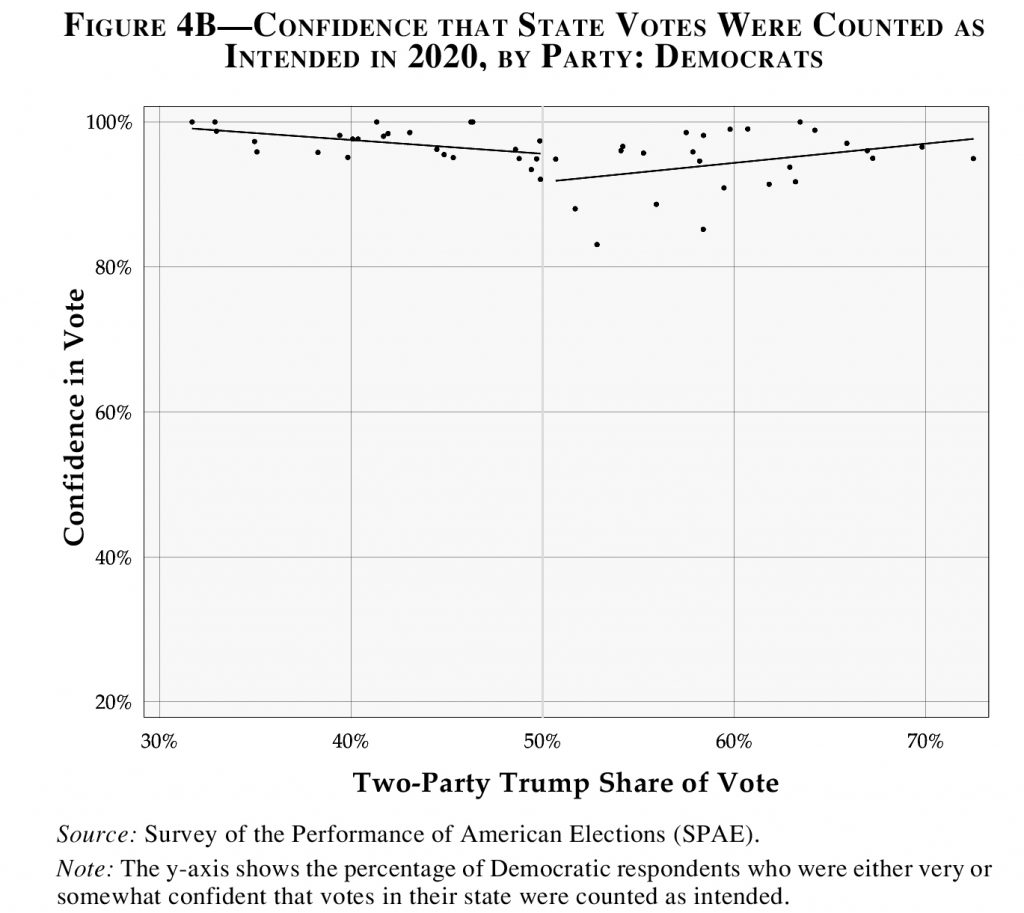
Data from the SPAE help to illustrate the point. Figure 4 plots the percentage of respondents from the two parties who were either very or somewhat confident that votes in their state were counted as intended against the percentage of the two-party vote received by Trump. The discontinuity right at the 50 percent mark in the Republican graph is stark. Among Republicans, simply living in a state that Trump barely won is worth approximately 40 points in confidence regarding whether state votes were counted properly, compared to living in a state that Trump barely lost. [End Page 173]
Republicans report being especially distrustful of the state vote count where Trump lost by less than three percentage points. And Republicans feel even more dissatisfied in states with high use of mail ballots—such as California, Maryland, New Jersey, Oregon, and Washington—and much less dissatisfied in states with low mail-ballot usage (Connecticut, Delaware, Maine, and New Hampshire).36 The gap among Democrats’ perceptions across different states was much smaller, and the usage of mail ballots had no influence on their attitudes toward the state vote count whether Trump won their state or lost it.
In almost every state, Democrats feel more confidence in the 2020 vote count than do Republicans, and by a wide margin. It is unsurprising, therefore, that immediately after the election news reports began to surface of efforts by Republican legislators to rein in forms of voting that Democrats seemed to favor. Across the country, state lawmakers from the Republican Party have put forward scores of bills to restrict mail balloting. The states with the most legislative activity are Arizona, Georgia, New Hampshire, and Pennsylvania.37
A Test Passed, a Future in the Balance
How the country interprets the 2020 election will, in many respects, shape the future of U.S. democracy. The electoral system confronted and passed its most severe test in recent memory. Any fair appraisal would focus on the heroism of election officials, civil society actors, and voters, who turned out in record numbers despite the threat of a pandemic. It would lead to renewed attention to the needs of election officials and the changing expectations of voters who increasingly seek flexibility in how they vote.
That legacy is far from guaranteed, however. The doubt cast on all aspects of the electoral process, from voting machines to ballot dropboxes to mail balloting, threatens Americans’ faith in the machinery of democracy and in those who dedicate their lives to administering it. On the receiving end of hate mail and death threats, large numbers of officials who administered the 2020 election are anticipating retirement, citing the political pressures of the job as a primary reason.38 It remains to be seen who will replace these veterans, given the pressure, low pay, threats, and lack of support from political leaders.
One consequence of the election may be a leadership crisis in election administration, as exhausted and frustrated officials step down and state and local governments struggle to find replacements who are equally dedicated to tireless and fair implementation of election laws. An even worse future will be in store if the next generation of election officials who step forward do so out of a conviction that the 2020 election was fundamentally flawed.
For longtime observers of election administration and law, the 2020 [End Page 174] election offers a number of obvious lessons that should demand immediate attention in state capitals and Washington, while the memory of the election is fresh. In particular, we stress the needs to fund election administration sufficiently, to clarify emergency legislation relating to elections, to cement ties between election officials and social-media outlets for communicating with voters, to enact comprehensive postelection-auditing programs, to develop workable observation procedures, and to acknowledge fully the critical role that the Postal Service plays in conducting elections. Other obvious issues that need attention include regularizing the use of drop-off locations for mail ballots, requiring greater use of the internet to track absentee ballots and manage mail-ballot transactions, establishing uniform standards for curing absentee-ballot defects, reforming the Electoral Count Act of 1887 to clarify the procedures for resolving disputes over Electoral College votes, and making election day a school holiday.39
Instead, the motivating memory driving much election-administration lawmaking is amplified through a continued barrage of false claims about the election. As state legislatures convene and begin their work, efforts are mounting to restrict absentee voting—by instituting heightened identification requirements, by shortening the period during which such ballots can be requested, or by eliminating no-excuse absentee voting. By the end of March 2021, state legislatures had seen the filing of at least 3,914 bills dealing with election administration, more than half of them addressing absentee or mail voting.40 While some of these bills are earnest attempts to adapt what was learned from the 2020 election to future mail-ballot policy, in most states these bills will likely provoke heated partisan debates in which grievances from the election will be relitigated. The overattention to mail voting to the neglect of the other pressing issues that arose during the election will result in a lost opportunity to improve the functioning of the election-administration system.
As the United States navigates its way forward, the stakes could not be higher. The 2020 election demonstrated how false claims about election fraud can lead to deadly results. At the same time, the election also demonstrated the resilience of U.S. voters and election administrators. The open question at this point is whether, when we look back on 2020, we will see it as a turning point in strengthening the mechanics of voting, or as the moment when a new generation of violent voter suppression began.
NOTES
The authors would like to thank Zahavah Levine, Chelsey Davidson, Alexandra Taylor, Tom Westphal, Claire De Soi, and the entire team at the Stanford-MIT Healthy Elections Project for their research assistance.
1. For a list of primary-date changes see “2020 State Primary Election Dates,” National Conference of State Legislatures, 3 November 2020, www.ncsl.org/research/elections-and-campaigns/2020-state-primary-election-dates.aspx.
2. For a complete description of the Wisconsin primary, which is only summarized here, see Grace Scullion et al., “Wisconsin’s 2020 Primary in the Wake of COVID-19,” Stanford-MIT Healthy Elections Project, 30 June 2020, https://healthyelections.org/sites/default/files/2020-06/Wisconsin%E2%80%99s%202020%20Primary%20in%20the%20Wake%20of%20COVID-19.pdf.
3. See John Curiel and Angelo Dagonel, “Wisconsin Election Analysis,” Stanford-MIT Healthy Elections Project, 6 August 2020, https://healthyelections.org/sites/default/files/2020-08/Wisconsin%20Election%20Analysis%20Version%202.pdf.
4. The exceptions were California, which was already transitioning to a quasi–vote-by-mail system in most counties; Florida, which has a flexible vote-by-mail system that swung into play during its March 17 primary; and Michigan, where voters had in 2018 passed a referendum providing no-excuse absentee voting.
5. Pam Fessler and Elena Moore, “More Than 550,000 Primary Absentee Ballots Rejected in 2020, Far Outpacing 2016,” Hawai’i Public Radio, 21 August 2020, www.hawaiipublicradio.org/post/more-550000-primary-absentee-ballots-rejected-2020-faroutpacing-2016#stream/0.
6. Kevin DeLuca, “Georgia Primary Election Analysis,” Stanford-MIT Healthy Elections Project, 15 September 2020, https://healthyelections.org/sites/default/files/2020-10/georgia_election_analysis_memo.pdf.
7. Blair Read, “North Carolina Election Analysis,” Stanford-MIT Healthy Elections Project, 19 July 2020, https://healthyelections.org/sites/default/files/2020-08/North%20Carolina%20Memo%281%29.pdf.
8. Carl Campanile, Nolan Hicks, and Bernadette Hogan, “Over 80,000 Mail-in Ballots Disqualified in NYC Primary Mess,” New York Post, 5 August 2020.
9. “Voting Laws Roundup 2020,” Brennan Center for Justice, 8 December 2020, www.brennancenter.org/our-work/research-reports/voting-laws-roundup-2020-0; “Changes to Election Dates, Procedures, and Administration in Response to the Coronavirus (Covid-19) Pandemic, 2020,” Ballotpedia, 19 November 2020, https://ballotpedia.org/Changes_to_election_dates,_procedures,_and_administration_in_response_to_the_coronavirus_(COVID-19)_pandemic,_2020.
10. Connor Clerkin et al., “Mail Voting Litigation During the Coronavirus Pandemic,” Stanford-MIT Healthy Elections Project, 29 October 2020, https://healthyelections.org/sites/default/files/2020-11/Mail_Voting_Litigation.pdf.
11. H.R. 748, CARES Act, Public Law 116-136.
12. Nicholas Riccardi, “Mark Zuckerberg Donates $100M More to Help Election Offices,” Associated Press, 13 October 2020.
13. “NBA Arenas and Facilities Being Used for 2020 Election,” NBA.com, www.nba.com/nba-arenas-polling-place-voting-center-2020-election; Alex Tausanovitch, Sarah Bonk, and Richard Eidlin, “17 Ways Companies Can Help Americans Vote Safely,” Center for American Progress, 9 September 2020, www.americanprogress.org/issues/democracy/reports/2020/09/09/490167/17-ways-companies-can-help-americans-vote-safely.
14. “Google Civic Information API,” Google, https://developers.google.com/civic-information.
15. “Voting Information Center,” Facebook, www.facebook.com/votinginformation-center.
16. “A Look at Facebook and U.S. 2020 Elections,” Facebook, December 2020, https://about.fb.com/wp-content/uploads/2020/12/US-2020-Elections-Report.pdf.
17. “Voter Turnout Data,” United States Elections Project, www.electproject.org/home/voter-turnout/voter-turnout-data.
18. The findings discussed in this paragraph are based on multivariate regression analysis available from the authors upon request.
19. Data on voting-mode usage from 1996 to 2016 come from various years of the U.S. Census Bureau’s Voting and Registration Supplement. Statistics from 2020 were calculated from responses to the Survey of the Performance of American Elections (SPAE).
20. Undertaken by MIT every presidential-election year since 2008, the SPAE is a post-election survey that is meant to gauge the experience of voters in the most recent presidential election. The survey is designed to allow comparisons across states. In 2020, the sample size was 10,800 respondents. In every state, at least two-hundred interviews took place.
21. The rate of mail-ballot usage among voters in states that mailed an application to all registered voters was virtually identical (48.8 percent) to the rate among voters in states that did not (47.6 percent).
22. The statistical analysis referenced here is available from the authors upon request.
23. Charles H. Stewart III, “Reconsidering Lost Votes by Mail,” Harvard Data Science Review 2.4 (Fall 2020), https://doi.org/10.1162/99608f92.6c591bd4.
24. “The Election Administration and Voting Survey: 2016 Comprehensive Report—A Report to the 115th Congress,” U.S. Election Assistance Commission, www.eac.gov/sites/default/files/eac_assets/1/6/2016_EAVS_Comprehensive_Report.pdf.
25. This settlement was challenged by Republican legislative leaders, but a 5–3 majority of the U.S. Supreme Court upheld it. See Christopher Middleton, “North Carolina: 2020 Election Policies and Practices,” Stanford-MIT Healthy Elections Project, https://healthyelections.org/sites/default/files/2020-11/northcarolina-110220.pdf.
26. Nathaniel Rakich, “Why So Few Absentee Ballots Were Rejected in 2020,” FiveThirtyEight, 17 February 2021, https://fivethirtyeight.com/features/why-so-few-absentee-ballots-were-rejected-in-2020.
27. “Election Results, 2020: Analysis of Rejected Ballots,” Ballotpedia, 10 February 2021, https://ballotpedia.org/Election_results,_2020:_Analysis_of_rejected_ballots.
28. “November 3, 2020 Election Data Report,” Wisconsin Elections Commission, 3 February 2021, https://elections.wi.gov/sites/elections.wi.gov/files/2021-01/D.%20November%202020%20Election%20Data%20Report.pdf.
29. Here we include ballots recorded as arriving after November 3, because the bulk of ballots rejected on account of signature problems are recorded as arriving after that date. This fact, and other details in the state absentee file, suggest that when recording these ballots, counties regularly entered the date on which they were rejected than the date on which they were received.
30. In a poll that the Pew Research Center took in August, before any states had begun distributing mail ballots, 60 percent of Trump supporters and 23 percent of Biden supporters said that they intended to vote on election day. African Americans were the demographic group most likely to express a preference for voting early and in person. See “Views of the 2020 Campaign and Voting in November,” Pew Research Center, 13 August 2020, www.pewresearch.org/politics/2020/08/13/views-of-the-2020-campaign-and-voting-in-november.
31. Cameron Joseph and Robert Arthur, “The U.S. Eliminated Nearly 21,000 Election Day Polling Locations for 2020,” VICE News, 22 October 2020, www.vice.com/en/article/pkdenn/the-us-eliminated-nearly-21000-election-day-polling-locations-for-2020. The authors thank Cameron Joseph for sharing the data that formed the basis of this report.
32. Charles Stewart III, “How We Voted in 2020: A First Look at the Survey of the Performance of American Elections,” MIT Election Data and Science Lab, 15 December 2020, http://electionlab.mit.edu/sites/default/files/2020-12/How-we-voted-in-2020-v01.pdf.
33. “The American Voting Experience: Report and Recommendations of the Presidential Commission on Election Administration,” U.S. Presidential Commission on Election Administration, January 2014, http://web.mit.edu/supportthevoter/www/files/2014/01/Amer-Voting-Exper-final-draft-01-09-14-508.pdf.
34. Michael W. Sances and Charles Stewart III, “Partisanship and Confidence in the Vote Count: Evidence from U.S. National Elections Since 2000,” Electoral Studies 40 (December 2015): 176–88; Betsy Sinclair, Stephen S. Smith, and Patrick D. Tucker, “‘It’s Largely a Rigged System’: Voter Confidence and the Winner Effect in 2016,” Political Research Quarterly 71 (December 2018): 854–68.
35. The method is this: First, calculate the gap in confidence (as expressed before the election) between supporters of the candidate who would go on to win and supporters of the candidate who would go on to lose. This is the preelection difference. Second, calculate the same gap after the election. This is the postelection difference. Third, calculate the difference-in-differences, which is simply the postelection difference minus the preelection difference. In 2020, for instance, the average preelection gap on the question about one’s own vote was 11 points (Democrats were more confident), while the average postelection gap was 52 points. The difference between the two was 41 points, which is the estimate reported in this paragraph. (All figures given in this note are rounded.)
36. This point is confirmed by a simple multiple regression in which we add the percentage of ballots cast by mail to the lines fit in the two figures. Among Republicans in states that Trump lost, each percentage-point increase in the use of mail ballots decreased state-level confidence by 0.239 points; in states that Trump won, the corresponding coefficient is 0.002 points. The former effect is significant at p < 0.026; the latter as a p-value of 0.967.
37. “Voting Laws Roundup: February 2021,” Brennan Center for Justice, 8 February 2021, www.brennancenter.org/our-work/research-reports/voting-laws-roundup-february-2021.
38. Fredreka Schouten and Kelly Mena, “High-Profile Election Officials Leave Posts After a Tumultuous 2020,” CNN, 19 February 2021, www.cnn.com/2021/02/19/politics/election-officials-lose-and-leave-jobs/index.html. See also Marie Albiges and Tom Lisi, “Pa. Election Officials Are Burnt out and Leaving Their Jobs After 2020 ‘Nightmare,'” Philadelphia Inquirer, 21 December 2020, www.inquirer.com/politics/election/spl/pennsylvania-election-2020-officials-retiring-nightmare-20201221.html.
39. Nathaniel Persily and Charles Stewart III, “A 12-Step Rehabilitation Program for American Election Administration,” Lawfare, 27 January 2021, www.lawfareblog.com/12-step-rehabilitation-program-american-election-administration.
40. National Conference of State Legislatures, State Elections Legislation Database, www.ncsl.org/research/elections-and-campaigns/elections-legislation-database.aspx.
Image Credit: Trevor Bexon/Shutterstock.com